Vector
Vector là agent có thể thu thập và push logs, metrics lên Bizfly Cloud Observability.
Chuẩn bị
Để push logs lên Bizfly Cloud Observability bạn cần có endpoint và bearer token để authen khi push.
- Bạn có thể có token bằng cách tạo hoặc reset token.
- Để lấy endpoint cho việc push logs, bạn có thể tham khảo hướng dẫn sau.
- Đã tạo Grafana user và có thể truy cập Grafana dashboard.
Push logs
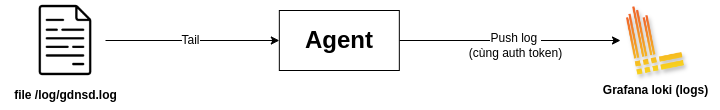
Dưới đây là cấu hình minh họa cho Vector để thu thập log từ file /log/gdnsd.log rồi push logs lên service Loki của Bizfly Cloud Observability.
Bước 1: Cấu hình
Tạo file vector.yaml và paste nội dung config sau:
  sources:
      source_gdnsd_log:
          type: file
          include:
              - /log/gdnsd.log
  sinks:
      loki_sink:
          type: loki
          inputs:
              - source_gdnsd_log
          endpoint: https://obs-xxxxxxxx-xxxx-xxxx-xxxx.obs.bfcplatform.vn
          path: /loki/api/v1/push
          auth:
          strategy: "bearer"
          token: "YOUR_LOGS_TOKEN"
          encoding:
          codec: "text"
          labels:
          filename: "gdnsd.log"
          healthcheck:
          enabled: false
Bước 2: Run
docker run -d -v $PWD/vector.yaml:/etc/vector/vector.yaml:ro -v /log/gdnsd.log:/log/gdnsd.log -p 8686:8686 --name vector --network host timberio/vector:0.39.0-debian
Bước 3. Xem kết quả trên Grafana dashboard
Để xem kết quả push logs trên Grafana dashboard của Bizfly Cloud Observability. Bạn có thể tham khảo hướng dẫn sau
Push metrics
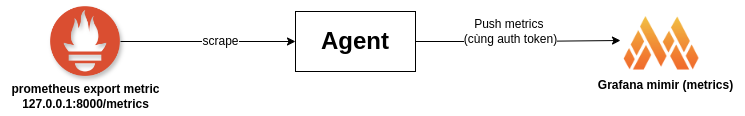
Dưới đây là các bước và ví dụ cấu hình Vector để thu thập metrics từ 127.0.0.1:8000/metrics rồi push metrics lên service Mimir của Bizfly Cloud Observability.
Bước 1: Cấu hình
Tạo file vector.yaml và paste nội dung config sau:
  sources:
      source_prometheus_scape:
          type: prometheus_scrape
          endpoints:
              - http://127.0.0.1:8000/metrics
  sinks:
      prometheus_sink:
          type: prometheus_remote_write
          inputs:
              - source_prometheus_scape
          endpoint: https://obs-xxxxxxxx-xxxx-xxxx-xxxx.obs.bfcplatform.vn/api/v1/push
          auth:
          strategy: "bearer"
          token: "YOUR_METRICS_TOKEN"
          healthcheck:
          enabled: false
Bước 2: Run
docker run -d -v $PWD/vector.yaml:/etc/vector/vector.yaml:ro -v /log/gdnsd.log:/log/gdnsd.log -p 8686:8686 --name vector --network host timberio/vector:0.39.0-debian
Bước 3. Xem kết quả trên Grafana dashboard
Để xem kết quả push metrics trên Grafana dashboard của Bizfly Cloud Observability. Bạn có thể tham khảo hướng dẫn sau